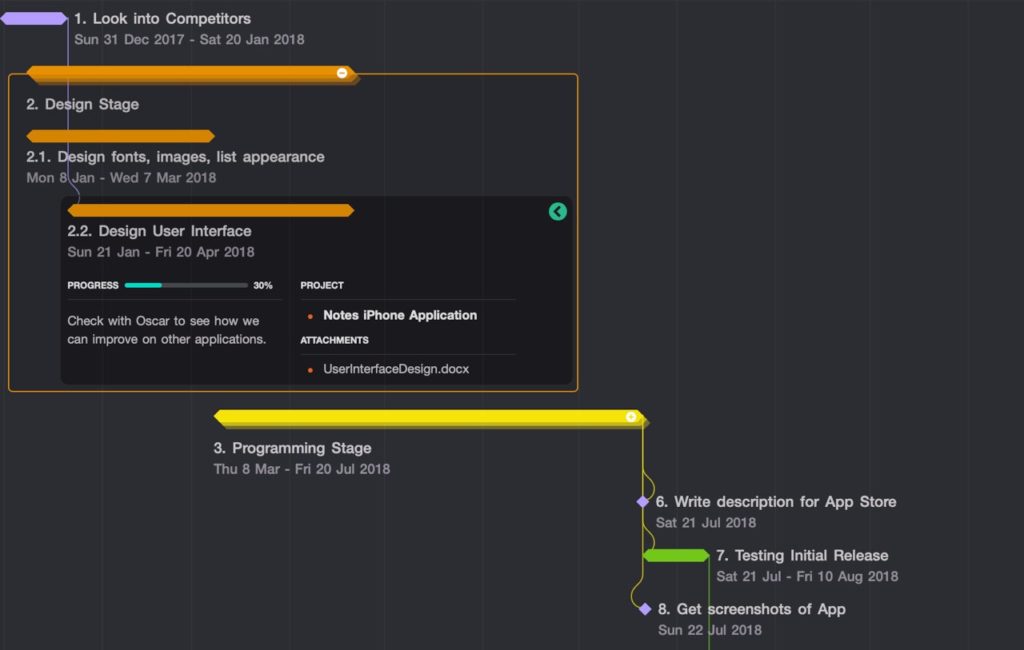
Gantt chart is a special type of bar chart which is used to represent various important correlations both managerial and academic. These charts simplify a complex progress situation with ease. In most of the projects mainly in construction ones, more than one activity prevails. All these activities make a real mess in the design of the project. Then, it becomes hard to estimate the time for each task; as a result, scheduling becomes difficult. In this critical situation, Gantt charts work as the ultimate savior.
In this article, we will explore the basics of Gantt charts in project management, the advantages of using them, their components, and how to create and use them effectively.
📖 Key takeaways
- Gantt charts are a powerful project management tool that helps teams visualize and manage complex projects. Whether managing a small project or a large, complex one, Gantt charts provide the clarity and structure needed to ensure successful project completion.
- Project managers can improve project planning, scheduling, and tracking by understanding the components of a Gantt chart and how to create and use them effectively.
- With the right Gantt chart software or tool, teams can streamline their workflows, increase productivity, and achieve project success.
Introduction
A Gantt chart is a powerful project management tool that helps teams visualize and manage complex projects.
An American engineer and management consultant, Henry Gantt, invented the Gantt chart in the early 1900s. His contribution to project management has been significant, popularizing these visual tools.
This chart has a duration on the horizontal axis and different tasks on the transverse axis. Then, the jobs are plotted on the chart. As you can see each activity separately, it will be easy for you to estimate the total period of the project, and also you can reschedule any of the activities smoothly.

It is a type of bar chart that shows the tasks, dependencies, and Gantt chart timelines of a project, allowing you, as project manager, and your team members to easily see tasks and responsibilities when they need to be done and what is the input and output of a specific activity.
Gantt charts are widely used in various industries, including construction, IT, and manufacturing, to plan, schedule, and track projects. They enable project managers to allocate resources efficiently, monitor progress, and ensure that all tasks are completed on time by providing a clear visual representation of the project’s schedule.
What is a Gantt Chart?
A Gantt chart is a project management tool that uses a horizontal bar chart to visualize a project plan. It displays tasks, the time needed to complete them, and how individual units of work connect to each other.
By providing a detailed overview of a project, Gantt charts make it easier to manage and track progress. They are particularly useful for planning projects from the start and managing all or part of a project.
With a Gantt chart, project managers can see the entire project timeline at a glance, identify potential bottlenecks, track milestones, and adjust schedules as needed to keep the project on track.
Why is the Gantt Chart a Must for Project Management?
1. Effective time management in project management
The leading benefit of using the Gantt chart in project scheduling is time management. All the eminent managers of this globe use this chart to manage multiple jobs perfectly. In any organization, progress depends on the strong collaboration of every level of employee.
So, it is a matter of time before all of the creative minds of the company can share their thoughts on a problem. When a lot of work appears on the same deadline, the Gantt charts can assist the management team in working out how to solve the problem. Thus, one can work out which task must be finished first, effectively managing the project schedule. Hence, the time can be used effectively.
2. Resource handling
A company generally has two types of resources- human resources and physical resources. Separate resource management personnel are there to utilize the capital wisely. A balanced usage of resources can get the establishment of the best result.
This is not a facile task to comply with. Project management tools, such as Gantt charts, will be an absolute help regarding this issue. If coupled with good project management software, a sequential combination of events can be tried in the Gantt chart to increase the productivity of the organization drastically.
In case you’re not aware which software would be a great fit to manage your team, here are the Top 10 Best Project Management Software that you can refer to.
3. Setting goals
Whenever a team is assigned to a task inside the firm, they first need to organize the project’s tasks by dividing the project into several small parts so that the fragmented jobs can be allotted to various experts of the team. All these things can be done in the Gantt chart. You can plot the project’s tasks concerning the stipulated duration in the chart. Thus it will be clear to you which job is the most important and which will take the maximum time to complete. According to that, the scheduling can be done by the team leader.
4. Clarity about project scope and requirements
A specific project may have a definite project scope and requirements to reach the goal. The demands of the project will be cleared out only after the complete scheduling of the project. It takes a considerable amount of effort and time to prepare the schedule manually. Rescheduling also becomes very difficult. So it will be effortless to know about the required resources after the preparation of the Gantt chart. Thus it can assist the leaders in the management of the project’s schedule.
5. Managing different activities
A project has several separate tasks that may be dependent on one other. So the managers should know to start with which job would be the most effective so that the entire project gets a good pace. He can easily figure out the above issue using modern Gantt charts. These charts show the status of a particular activity concerning time- if any activity is running out of deadline, that can also be perceived from Gantt charts. Additionally, Gantt charts are essential for visualizing the project’s timeline, helping teams track progress, and managing steps crucial for achieving project success.
6. Effortless communication
In giant corporations, communication between the employees of distinct departments is not so trouble-free. It may be an upward or downward circulation- the working staff may be busy with other tasks. So Gantt charts are used to allow the employees to get a simple method of communication. All the required information about the project can be updated along with the obligatory directions in Gantt charts. So that the employees can be directed flawlessly and they may also place their queries in the portal. Gantt charts also help in tracking project progress, providing real-time updates and allowing project managers to make necessary adjustments based on task completion and delays.
7. Budget estimation
The cost estimation of a project is surely a very important task. The managers deploy the budget for a project after doing a lot of research on it. If you know about the perfect required duration of a project, you can get a clear idea about the expenditure. So it will be a great help to use Gantt charts for budget estimation and managing project plans effectively.
8. Source of motivation
Gantt charts can be a good source of motivation for the workers of the company. Any update of the progress of the project is shown in Gantt charts, which are essential tools for tracking progress. If any lagged assignment is shown on the chart, the employees will be motivated that they have to work hard to get it done. In this way, the Gantt chart can be the ultimate source of motivation in a corporation.
9. Information sharing
There is a lot of information to be shared at the time of the initialization of the project work. Hence all the members associated with the assignment have to know about the details of the task. But it is nearly impossible to convey every information update to each person. So it will be an intelligent step to use Gantt charts for uploading the details in the chart so that all the necessary info can be shared effortlessly. Gantt charts serve as an effective project management chart, making it easier for project managers to share information and keep everyone updated.
10. Increased productivity in the team game
A good team with good coordination between the team members can decrease the headache of the administrator in various ways. A project manager can use a Gantt chart to increase team productivity by breaking down projects into smaller tasks, identifying dependencies, and maintaining strategic oversight. In the Gantt chart, the progress of all the jobs is published publicly. Thus, the members sometimes feel a competition between them, which indirectly results in a fantastic growth in the productivity of the company. Not only for teams, if you’re a freelancer earning money from home, you could also consider this ideology if you’re managing a team remotely.
These are some benefits that you can avail yourself while using the Gantt chart in project management. A digital Gantt chart is a useful tool for nurturing the growth of any organization. It will provide the company with a positive result surely.

Key Components of a Gantt Chart
A Gantt chart typically includes the following components:
1. Task list
The task list is a vertical list of project tasks on the left side of the chart that lists all the tasks and activities involved in the project. This list typically includes a variety of tasks, such as planning, design, development, testing, and deployment.
Larger tasks can be broken down into smaller, manageable tasks to ensure clarity and ease of tracking. These are summary tasks.

By organizing tasks this way, you, as a project manager, can effectively plan and monitor each phase of the project and, in such a way, ensure that all tasks are aligned with the overall project schedule.
2. Taskbars
Taskbars in a Gantt chart are represented as horizontal bars that indicate the duration of each task. They are crucial for visualizing the project’s timeline and understanding how tasks interrelate with each other.

Different symbols and colors can be used within these taskbars to convey additional information:
Color Coding
Taskbars are often color-coded to represent different phases of the project, task priorities, or the status of task completion.
For example, green might indicate completed tasks, yellow for tasks in progress, and red for overdue tasks.

Icons for Task Status
Small icons or symbols can be placed within or next to taskbars to indicate specific statuses such as ‘in progress’, ‘completed’, ‘on hold’, or ‘delayed’. These icons provide a quick visual cue about the current state of each task.
Milestone Markers

Diamonds or other distinct shapes can be used to denote milestones within the taskbars. Milestones are significant points in the project timeline, such as the completion of a major phase or the delivery of a key project component.
Dependency Arrows

Arrows are often used to link taskbars, illustrating dependencies between tasks. These arrows show the sequence in which tasks must be completed, helping project managers understand the flow of the project and identify potential bottlenecks.
Progress Indicators

Taskbars may include progress lines or shading to show how much of the task has been completed. This visual representation will help you track progress and identify lagging tasks.
By incorporating these symbols and visual cues, Gantt charts become a more effective project scheduling tool. They allow project managers and team members to assess the project’s status quickly and make informed decisions.
5. Critical path
Highlights the longest sequence of dependent tasks that determine the project’s duration. Usually, Gantt chart tools with integrated Gantt charts will automatically generate critical paths. For example, the Merlin Project tool I am using for this article automatically recognizes whether or not activities are on a critical path.

6. Resource allocation
Resource allocation is the assignment of resources, such as team members, equipment, and budget, to specific tasks.
These components work together to provide a comprehensive view of the project’s schedule, helping project managers to plan, execute, and monitor the project’s progress effectively.
How to Create a Gantt Chart?
If you are a project manager, to create a Gantt chart, you can follow these steps:
1. Define the Scope and Tasks of the Project
I have seen many people start creating their Gantt charts when they have only an idea about the project. At this step, you must clearly outline the project’s objectives and break down the work into specific tasks that must be completed to achieve them.
You can start by identifying the project’s overall goals and what you aim to achieve upon its completion. This will provide clear direction and ensure that all team members are aligned with the project’s purpose.
Once you have the project’s objectives, you can decompose the project tasks into smaller, more manageable tasks. So, you must list every task required to complete the project, no matter how minor it may seem. In such a way you will ensure that no critical steps are overlooked, and you can better organize the workflow.
Next, consider grouping related tasks into phases or categories to maintain clarity and facilitate easier tracking. This structured approach not only aids in creating a complete Gantt chart but also improves the overall project management process by providing a clear roadmap from start to finish.
Let’s consider a simple project: organize a community charity event. The first step in creating a Gantt chart for this project is to define its scope and break it down into specific tasks.
The goal of this project is to successfully organize a community charity event that includes a fundraising dinner, entertainment, and a silent auction. The event aims to raise funds for a local shelter and increase community awareness about the cause.
You can use mind-mapping tools to help you define these tasks:

By clearly defining the project scope and breaking it down into manageable tasks, you can create a comprehensive Gantt chart that helps organize and track the project’s progress effectively.
2. Determine the Dependencies Between Tasks
Now, you can put your tasks inside your Gantt chart tool and define dependencies between tasks.
So, after listing out all the tasks for your project, the next crucial step is to determine the dependencies between these tasks. Dependencies refer to the relationships between tasks that dictate the order in which they must be completed.
For example, some tasks cannot start until others have been completed, while others might need to run concurrently.
In the context of our community charity event, let’s identify some task dependencies:
- Venue Booking: Before you can send out invitations, you must secure a venue. Thus, “Book Venue” is a prerequisite for “Send Invitations.”
- Catering Arrangements: This task depends on the completion of the “Finalize Guest List,” as the number of attendees will influence the catering requirements.
- Entertainment Booking: The entertainment lineup should be confirmed before finalizing the event schedule, making “Book Entertainment” dependent on “Decide on Event Schedule.”
- Silent Auction Items: Gathering auction items must be completed before the event, but it can run parallel to other preparations like the “Design Event Program.”
- Event Setup: This task can only begin once the venue is ready, so “Event Setup” depends on “Venue Preparation.”
3. Specify Start and End Dates for Each Task
At this step, when you have defined clearly all tasks, including summary tasks, you must specify start and end dates for each task.
To effectively create a Gantt chart for our community charity event example, we need to specify start and end dates for each task.
You can use your MindMap and add these dates, or create a spreadsheet where each task will be listed and, in specific columns, add data.
For example, you can have something like this with the:

Assigning specific start and end dates to each task creates a clear project timeline, enabling you to track the project’s progress and make necessary adjustments. This structured approach for Gantt chart creation will ensure that all tasks are completed efficiently, reducing the risk of project delays.
4. Determine Key Milestones
Now, you need to add all your key milestones to your Gantt chart. These will help you as a project manager later to check progress and keep the project on track.
For our community charity event example, let’s add some key milestones and the reasoning behind them:
- Venue Confirmation: This is a critical milestone because the venue is the foundation of all other event planning activities. So this is an important milestone because without a confirmed venue you can’t send out invitations or arrange catering. You can see how milestones will help with project management.
- Final Guest List: This milestone is for catering and seating arrangements. Knowing how many attendees will help with logistics decisions.
- Entertainment Lineup: This milestone completes the event schedule and allows for promotion. A confirmed entertainment lineup will also attract more guests and sponsors.
- Auction Items Collected: This milestone is big because it impacts fundraising. Having all auction items in well before the event allows for proper cataloging and display.
- Event Setup: This milestone is when the venue is ready for the event day. Having everything set up before the event day reduces last-minute stress and makes the day run smoother.
By adding these milestones, project managers can monitor progress, tackle issues early, and keep the project on track. These milestones give the team a clear direction and motivation by showing progress along the way.
5. Assign Resources to Each Task
Allocate the necessary resources, such as team members, equipment, and materials, to each task. If you use a specific Gantt chart software or tool to input resources, types, availability, etc. When you input everything from all of these steps, you will have a comprehensive project plan in the form of a Gantt chart.
6. Modify Work as Plans Change
Remember that many times, project plans will need to be changed. So, it is better to use a Gantt chart tool that will be able to allow you modification of your whole project plan.
For example, a community charity event where unexpected things happen, like weather or a vendor canceling at the last minute. You need to adjust the project schedule.
With flexible Gantt chart software, you can update task timelines, reassign resources and budgets, or shift dependencies to accommodate these changes.
For example, if the outdoor venue for the event is no longer available due to weather, you can use the Gantt chart to reschedule the setup tasks and get the team to secure an indoor location.
Gantt Chart Best Practices
To get the most out of a Gantt chart, follow these best practices:
- Determine the critical path in the Gantt chart: Identify the longest sequence of dependent tasks after you make a Gantt chart that must be completed on time for the project to finish on schedule.
- Use a work breakdown structure: Break down the project into smaller, more manageable tasks to ensure all aspects are covered.
- Identify clear task dependencies in the Gantt chart tool: Clearly define the relationships between tasks to avoid delays and ensure a smooth workflow.
- Allocate resources wisely: Ensure that resources are distributed efficiently to avoid overloading team members and to keep the project on track.
- Monitor progress regularly: Continuously track progress and update the Gantt chart to reflect any changes, ensuring that the project stays on schedule.
What to Look for in a Gantt Chart Software
If you’re going to invest in a tool for Gantt charts for project management, here are the features to look for:
- Drag and Drop Scheduling: This allows you to move the project timeline around with a simple drag and drop. Makes task management easy and quick to update the project schedule.
- Real-Time Collaboration: This allows multiple team members to access and update the Gantt chart at the same time so everyone is on the same page and the project runs smoothly.
- Task Dependencies: This allows you to define and see the relationships between tasks. By setting dependencies, you can ensure tasks are done in the right order and don’t get bottlenecked or delayed.
- Resource Allocation: This allows you to assign resources like team members, equipment, and budget to specific tasks. It helps to optimize the use of available resources and avoid over-allocation.
- Progress Tracking: This feature shows a visual representation of the project’s progress so you can monitor task completion and identify any delays. So the project stays on track and issues are addressed quickly.
- Customizable Views: Users can customize the Gantt chart to show what they need, such as task details, timelines, or resource allocation, to make it more usable and effective.
- Milestones: This feature allows you to mark important events or deadlines within the project timeline so you have clear target,s and the project stays on track.
- Reporting and Analytics: Advanced Gantt chart tools have reporting capabilities that give you insights into project performance, resource usage, and progress to help you make informed decisions.
- Integration with Other Tools: Integration with other project management tools or software like time tracking or communication platforms makes it more functional and streamlined.
- Mobile Access: With mobile access, users can view and update the Gantt chart on the go, ensuring flexibility and continuous project management even when away from the desk.
Gantt Chart Alternatives
The Gantt chart is not the only way to create and visualize project plans. Instead of a Gantt chart timeline, we can use other visualization tools such as network diagrams, PERT charts, and Kanban boards.
Let’s briefly look at all of them and see what the difference is with Gantt charts.
Network Diagram
Network diagrams are a great project management tool to visualize the order of tasks and dependencies within a project. Unlike Gantt charts, which show the project timeline in a horizontal bar chart, network diagrams show the relationships between tasks and the order in which tasks must be completed. This makes them perfect for complex projects with multiple tasks and dependencies.
By mapping out the task sequence, project managers can see task dependencies and critical paths. They can then ensure all tasks are completed in the right order to avoid project delays. Network diagrams also help with resource allocation by showing which tasks require which resources and when. This is a key part of project planning so project managers can allocate resources efficiently and track tasks better.
Project managers use network diagrams alongside Gantt charts to create a full project plan. Gantt charts show the project schedule and network diagrams show the task dependencies and overall project flow. This combination allows project managers to track progress, manage task dependencies, and keep the project on track to finish.
PERT Chart
PERT charts, or Program Evaluation and Review Technique charts, are used to sequence tasks, estimate project duration, and identify critical path activities in project management. They provide a graphical view of a project timeline, showing the sequence of tasks and their dependencies so you can plan and schedule complex projects better.
A PERT chart breaks down the project into individual tasks and shows them in a flowchart format that highlights the relationships and dependencies between tasks. This allows you to identify the critical path, which is the longest sequence of dependent tasks that determines the shortest possible project duration. By focusing on the critical path, you can allocate resources better, and the project will run smoothly without delays.
Also, PERT charts are used for estimating project duration. They use three time estimates for each task—optimistic, pessimistic, and most likely—to calculate the expected project end date. This probabilistic approach gives a better view of the potential project timelines so you can anticipate and mitigate risks.
Kanban Board
Kanban boards are also a great way to visualize project tasks. This project management tool can be used for managing everyday tasks and workflows because with Kanban, the tasks are divided into:
- completed tasks.
- to-do tasks,
- in-progress tasks and