Do you know your sales funnel metrics? This is important for you and your business to achieve business growth.
Most entrepreneurs I know always seek ways to increase their conversions and revenue. How you manage your sales funnel determines your success or failure. There are important sales funnel metrics you need to know if you want to ensure business growth.
Remember that the sales funnel is one of the most important business elements to increase your overall business potential energy. If you still haven’t designed your sales funnel, follow the article on how to build all stages of your sales funnel.
This post is related to the most critical sales funnel metrics with which you can easily implement improvements in your sales process. If you want to learn more about what to include, read how Amazon uses its sales process.
If you know the numbers, you will know the metrics and elements that must be improved to increase the business potential energy of your sales process and overall business. Furthermore, these metrics are the basis for knowing the right amount of your business’s potential energy.
Let’s see what are the most important sales funnel metrics. But, first, let’s start with the sales funnel management.
Sales Funnel Management
Sales funnel management is all about managing each stage of the sales funnel. It starts with attracting people to the sales funnel and ends with converting them into buyers. You, as an entrepreneur, must properly manage your sales funnel to avoid losing leads and customers. Mismanaging the sales funnel can negatively impact your company, especially by decreasing sales, so income, profitability, customer retention, and market share.
For example, if you focus only on attracting people to the sales funnel and neglect the importance of nurturing them, you will lose potential customers. Also, if you fail to monitor your sales funnel metrics, you won’t be able to identify the stages where the leads are dropping off and take necessary actions to fix the issue.
If you’re not measuring your sales funnel, you won’t know what works and what doesn’t. You can’t make improvements if you’re not tracking what’s happening inside your sales funnel.
So, when we talk about the sales funnel, your job as an entrepreneur or sales manager is to properly manage each stage of the funnel and track the following metrics:
- Entry point metrics. These metrics will help you analyze your marketing and sales efforts to bring possible leads inside your sales funnel.
- Conversion rate metrics. You must track these metrics to measure how many leads are moving from one stage of the sales funnel to another and how they impact the overall conversion rate.
- Endpoint or purchase metrics. Purchase metrics are the metrics that you must track to evaluate the effectiveness of your sales strategy. Analyzing these metrics, you can identify potential areas of improvement
- Sales funnel quality metrics. These metrics can help you analyze your sales process’s effectiveness and locate possible areas for improvement.
Related: How to Develop and Improve Your B2B Sales Processes
Now, let’s go define the most important metrics, what they mean, and how to calculate them.
1. Entry Point Metrics
The first funnel metric that should always be measured is the entry point of the sales funnel.
When does your sales funnel start? Is it when someone signs up for your newsletter? Is it when they click on an ad? Or is it when they complete an online form? Is it when they make their first contact with your business? What’s the answer?
For example, the amount of people who come to your website through a specific entry point is called your “entry point” or “amount of entrance.”
This is the number of leads or potential customers that enter your sales funnel in a certain period through different entry points. Simply, these sales funnel metrics are expressed in terms of numbers. Furthermore, the entrance can be expressed in terms of forecast numbers if you make projections for your funnel.
Related: 8 Ideas to Help You to Create Your Own Sales Leads Databases
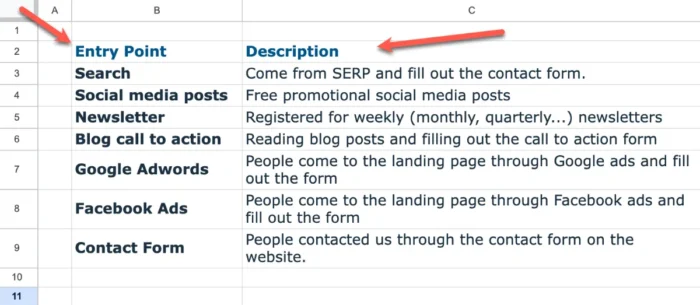
Define All Possible Entry Points
If you want to find the real numbers, you must previously define the borders of your sales funnel if we can say today that there are some borders. This means that you need to know when your sales funnel starts. These borders can be when customers come into your sales store, leads that contact your sales department, leads that are contacted by your sales department, potential customers who visit your website or subscribe to your newsletter, and so on.
If you want to know the real numbers at your sales funnel entry points, you must define all your business efforts that bring leads into the sales funnel. When you know this, you can start to measure over a period of time the real numbers.
Let’s say that one of the entry points inside your sales funnel is your website, where you have a landing page with a subscription form. When visitors complete the form and click submit button, they become part of your sales funnel.
To bring visitors to your landing page, you use SEO and get visitors from search results. Also, you have a blog where you publish articles that solve problems for your potential customers. In each blog post, in the end, you have a call to action that will bring visitors to your landing page. Another way to bring visitors to your landing page is to use paid advertising. So, in this case, you will have three different entry points to your landing page.
Now, it is time to think about your entry points and write them inside Google Sheets or whatever you use. You will need to have something like this:
Number of Leads Through Different Entry Points
So, now you know all entry points inside your sales funnel and it is the right time to develop all important metrics.
Continuing with the previous case, you will have three metrics at the start:
- Number of visitors on your landing page through search engines,
- Number of visitors on your landing page through blog articles,
- Number of visitors you get through paid advertising, and
- The number of visitors you get through social media channels.
Congratulation, you have defined your first four metrics related to entry points for your sales funnel.
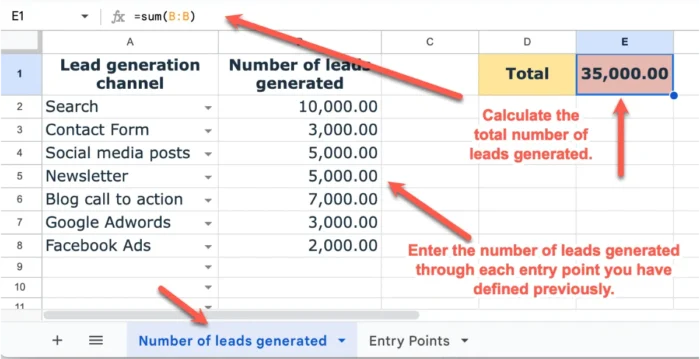
Now you can make simple math by collecting numbers from different efforts that bring potential customers close to your funnel. If you continue with the Google Sheets, you can create a new sheet and add the number of leads that are entered inside your sales funnel for the analyzed period.
2. Conversion Rate Metrics
These are the second group metrics that are one of the most important metrics that will tell you how your sales and marketing strategies perform.
Generally, I want to differentiate three types of conversion rates regarding your sales funnel:
- Entry points conversion rate
- Overall conversion rate
- In-process conversion rates
Entry points conversion rates
Your goal with this measure is to know how your different efforts to bring leads inside your sales funnel convert in two different ways:
1. Conversion rate of different channels
The first is related to the conversion of your efforts. How many leads bring each entry point inside the sales funnel? With the previous measure, you already know the number of potential leads that come to your landing page through SEO, blog articles, and advertising.
But, this measure will not tell you anything important for your business. It is because, for example, you bring 10.000 visitors to your landing page, but only 2000 of them subscribe for more information. Only those who subscribe become part of your sales funnel.
So, now you have a conversion rate from different channels you use to bring potential customers to your landing page.
Let’s say that you get these numbers:
- Landing page SEO: 10.000 visitors and 2.000 subscribers,
- Blog articles: 8.000 visitors and 2.000 subscribers and
- Advertising: 10.000 visitors and 1.000 subscribers
Having these numbers, you can easily calculate the channel’s conversion rates by dividing the number of subscribers by the number of visitors and multiplying by 100 to get them in the form of a percentage. So, you will have the following conversion rates (CR):
- Search CR = 2.000/10.000 = 0.2 x 100 = 20%
- Blog articles CR = 2.000/8.000 = 0.25 x 100 = 25%
- Advertising CR = 1.000/10.000 = 0.1 x 100 = 10%
This means that 20% of visitors coming to your landing page through search results become part of your sales funnel, 25% from blog articles, and 10% from advertising. In this case, only 5.000 leads you will get from 28.000 visitors to your landing page, or the overall conversion rate of your landing page will be 5.000/28.000 = 0.1786.
Now, if you have different landing pages, you can easily compare these conversion rates and work on improving these numbers or implementing A/B testing.
2. Leads quality
The second metric is related to each entry point’s quality of leads.
What do I mean about the quality of the leads?
When I talk about the lead’s quality, I think of comparing what channel brings more quality leads. For example, not all of the subscribers will become your customers in the end. Also, not all customers coming from different channels will spend the same amount of money in your company. The same is true when it comes to buying frequency of those customers. Not all of them will recommend your products and services to their friends.
So, it is important to use this metric to see where you will need to put most of your efforts for the most optimal results. Let’s continue with the same example:
- 200 subscribers from search become your customers
- 400 subscribers from blog articles become your customers
- 80 subscribers from advertising become your customers
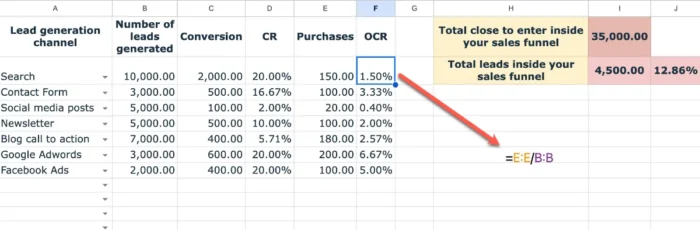
Now, the overall conversion rate (OCR) per channel, in this case, will be:
- Search OCR = 200/10.000 = 0.02 (2%)
- Blog articles OCR = 400/8.000 = 0.05 (5%)
- Advertising OCR = 80/10.000 = 0.008 (0.8%)
As you can see, in this case, the best channel is the blog because, compared to other channels, have the largest OCR. Also, this can tell you that you can improve something on your landing page and advertising tactics, especially in targeting or something inside your offer.
3. Overall Sales Funnel Conversion Rate
The overall sales funnel conversion rate is the ratio of the potential customers that your sales funnel transforms into the buyers at the end of the sales funnel and potential customers that become part of the funnel.
For example, a 30% overall conversion rate means that 30% of the people that become part of your sales funnel have bought something from your business. The overall conversion rate depends on the next type of conversion rate we will talk about here.
But, first, let’s calculate the overall sales funnel conversion rate (OSFCR) for our example. First, we know that we have 5.000 subscribers that become part of our sales funnel. Next, we know that 680 (200 from search, 400 from blog, and 80 from advertising) of them become our customers. Now, we can easily calculate this funnel metric by dividing the number of customers (680) by the number of leads inside the funnel (5.000). In this case, our OSFCR will be 680/5.000 = 0.136 or 13,6%.
This means that with these three channels, we will generate 13,6% of customers from the total leads we generate into our sales funnel.
4. In-process Conversion Rates
Your sales funnel has different stages. These elements can be awareness, interest, desire, and purchasing. For example, when the sales team contact potential customer, only part of them will be aware of your products or services. That is the first in-process conversion rate.
After that, a small part of potential customers with awareness will have an interest in your products and services. That is the second in-process conversion rate.
Next, the small part of the leads with interest will have a desire to purchase something and this is the third in-process conversion rate. And at the end, the part of potential customers with a desire purchases something. In this sales funnel with such elements, we can have 4 different in-process conversion rates:
- CA – The conversion rate converts entrants into leads that are aware of your business, products, and services.
- CI – The conversion rate converts leads with awareness into leads with interest.
- CD – The conversion rate converts the leads with interest into leads with desire.
- CP – The conversion rate converts the leads with desire into buyers.
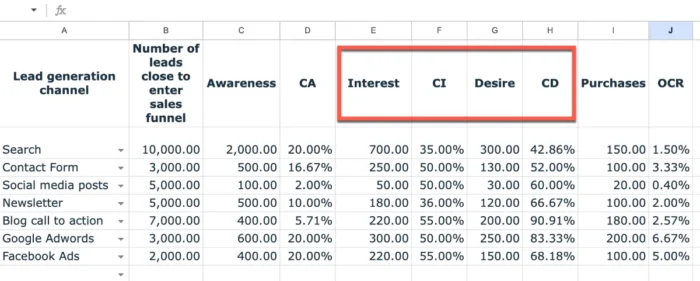
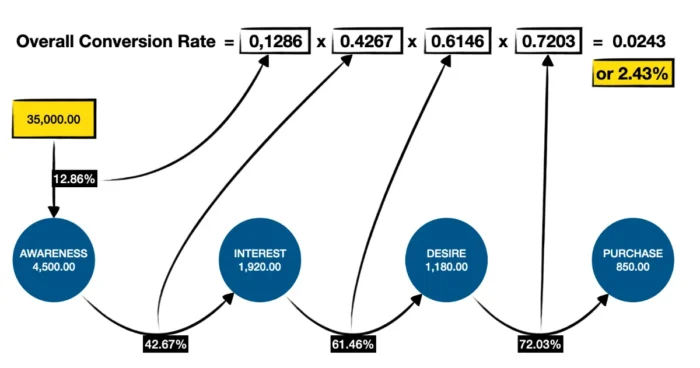
When you put the number of leads that go to the next stage and calculate the percentage of leads that go to the next stage you can have something like this:
Now, I want to have more visualization that will show me immediately possible areas for improvement.
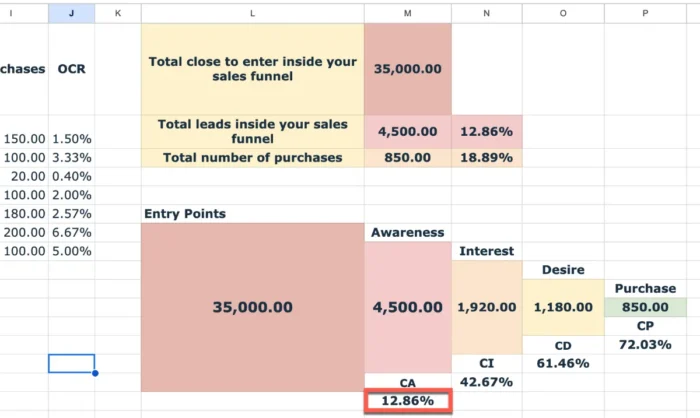
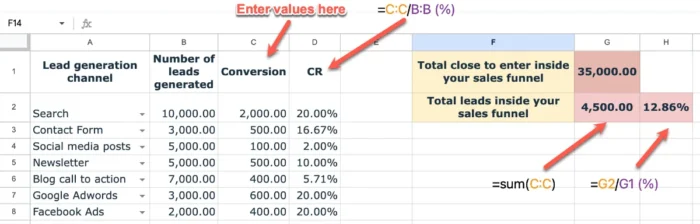
As you can see from entry points to awareness we have a conversion rate (CA) of 12.86%, next is the interest conversion rate (CI) which is 42.60%, desire conversion rate (CD) is 61.46%, and purchase, or CP is 72.30%. Generally, there are good in-process conversion rates, but what is visible the most is the low conversion rate from entry points into the awareness.
This means that we can have some room for improvement here.
The 12.86% rate tells us that for 100 generated visitors to a landing page, readers that see your advertisement in your local newspaper, or whatever you use to generate potential leads, the awareness will show only 12-13 leads. They become aware only when take some steps to become a part of your sales funnel. For example, they fill out the subscribe form, they send you questions through the contact form or anything else that will show their awareness that your products or services exist and they can easily use them to solve a specific problem.
So, probably I will need to change something on my landing page to motivate them to subscribe. Or, I will need to change the call-to-action (CTA) or visuals for newspaper advertising. Now, this means that it is time for A/B testing to experiment and work on the improvement of this conversion rate.
How to Calculate Overall Conversion Rate?
With these four in-process conversion rates, you can easily calculate your overall conversion rate (C). You can calculate this by simply multiplying all in-process conversion rates:
(C) = (CA) X (CI) X (CD) X (CP)
You can now play with numbers and simulate to find ways for possible improvements to your overall sales process.
As you can see from this example, as a lead goes through the sales funnel stage, she becomes a lead with higher purchase intent. So, probably you will want to change something in your target market and find customers with the right purchase intent for you.
Second Way to Calculate Sales Funnel Overall Conversion Rate
There is another way to calculate the overall conversion rate that you can use when you know the number of buyers at the end of the funnel. For example, if you have 4000 entrances and at the end of the funnel 280 of them buy something from you, then the (C) will be:
(C) = (280 : 4000) x 100 = 7%
The process of finding in-process conversion rates is more difficult than capturing customers at the end of the funnel to divide by the number of entrances. However, you can also use the (CP) to find the in-process conversion rates. My recommendation is to know the in-process conversion rates because they are important for finding possible areas for improvement of the sales funnel.
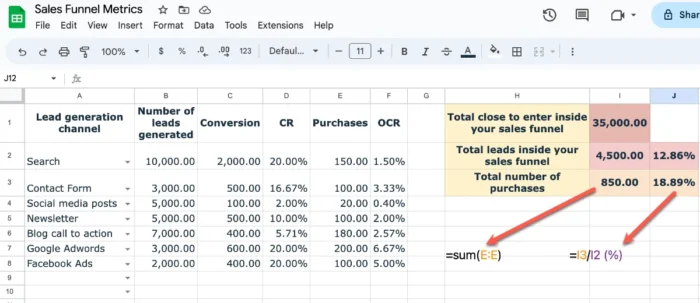
3. Purchase Sales Funnel Metrics
Purchase funnel metrics are the metrics that you want to track to evaluate the effectiveness of your sales strategy. These metrics include the total number of purchases that we already calculated in the previous metrics and average sales. Analyzing these metrics you can identify potential areas of improvement, such as increasing the average sale value, providing personalized recommendations, or simplifying the sales process.
Average sale is the value expressed in currency generated at the end of your sales funnel. This measure is the average dollar spent by one customer.
This is an important metric in each sale funnel. With this metric, you can see the value of your sales funnel.
For example, if you find that this number is too small you can do market research. Next, you can find the target market that will spend more money at the end of the funnel.
You can calculate this metric when you divide overall income for the specific time by the number of customers your sales funnel has generated. For example, if you generate $28,000.00 from 280 customers, then the average sale will be $100 by one buyer.
This metric will help you determine what is the average value of one customer and how it changes over time. Furthermore, when you compare it with your advertising cost and other investments, you can find out the return on investment (ROI).
4. Sales Funnel Quality Metrics
Sales funnel quality metrics are the metrics that you will track to evaluate the quality of your leads and customers. These metrics include the exit rate and the average time in the funnel.
1. Exit rates
This is an essential metric in sales funnel management because they help you measure the percentage of leads who leave your sales funnel without completing the desired action for the specific stage. Exit rates are important because they indicate the effectiveness of your sales funnel in guiding leads toward the desired outcome.
The overall exit rate is calculated by dividing the number of exits by the total number of customers at the end of the sales funnel, or in stages. A high exit rate can be an indication that there are issues with the sales funnel that need to be addressed.
High exit rates at any of the stages can indicate specific issues with that stage of the funnel. For example, a high exit rate on the awareness stage could indicate that the landing page is not engaging enough, or that the call-to-action is not strong enough to encourage visitors to continue to the next stage of the funnel.
By understanding where leads are leaving the funnel, you can make improvements to address those specific issues. For example, you might optimize your landing page by improving the design, copy, or call-to-action to reduce the exit rate and encourage more leads to continue to the next stages of the funnel.
2. Average Time in Funnel
How long does it take customers to go from lead to purchase? This is the question that this metric will answer for us.
How long it takes for people to complete a step, from start to finish?
The duration of the sales process is the time that is spent by one potential customer to become a buyer. This is an important metric that measures the quality of your sales funnel. If this time is very long then the quality is at the lower level. You can find these metrics if you measure the time when the lead becomes a part of your sales funnel.
Next, you need to subtract this time from the time when that customer decides to purchase from you.
Let’s say you have a database that will tell you when the specific lead becomes a part of your sales funnel. For example, when she has subscribed to your email newsletter. Let’s say it is January 5th, 2023. On April 30, 2023, the same lead make an order and purchase something from you. Now, when you subtract the subscription date from the purchase date you will know that for this lead the sales funnel has a duration of 115 days. So, having a database like the image below will help you to understand how to improve your sales funnel.
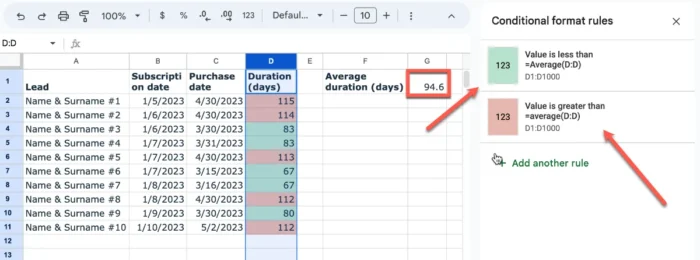
Looking at these data and calculations in Google Sheets combined with conditional formatting, I can easily understand two things:
- The average time in the sales funnel is 94.6 days. So, I will ask myself what I need to do to decrease this number.
- Next, I will look inside red formatted durations for specific leads and ask myself why they have above the average duration time.
So, the response to these questions will help me identify what I will need to do next. First to decrease average time, identifying problems with all leads with above average time. If I succeed to improve all leads to have a duration time close to the average time, then I will try to improve specific steps inside the lead nurture process.
3. Average time spent in each stage
Here I also recommend finding the single duration of each element of the sales funnel. If you know what is the sales funnel duration time for potential customers to pass all in-process elements, you will find the elements you need to improve. For example, you can ask yourself:
- Why does this stage have so long duration?
- How I can decrease this time?
- What steps I will need to take to decrease this time?
Conclusion
Sales funnel metrics are crucial to your success because they will help you identify which aspect of the funnel could be improved and what is working efficiently.
By tracking and analyzing your sales funnel metrics, you can identify potential areas of improvement, optimize your sales strategies, and achieve business growth. Therefore, you need to focus on these metrics and make data-driven decisions to improve your sales funnel performance.