
Tracking KPIs (Key Performance Indicators) is crucial for startups to determine whether efforts and investments are paying off with desired results and target revenue. Key performance indicators are critical analytical tools that remind you to simplify, expand, or implement an exit strategy in the worst-case scenario.
Remember, without proper tracking and analysis, it can be difficult to measure the success and growth of your startup. That’s where key performance indicators come in. Tracking the right key performance indicators allows you to monitor and measure the progress and performance of your startup, whether it’s customer acquisition, revenue growth, or user engagement. By focusing on these metrics, you can identify possible improvement areas, uncover hidden opportunities, and optimize your strategies to drive success.
This article will explore the must-track startup KPIs that can increase the chance of your startup’s success and help you make data-driven decisions.
Here are some of the most important startup KPIs with examples:
Financial KPIs for Startups
1. Revenue growth rate
The revenue growth rate measures the percentage increase in your startup’s revenue from one period (month, quarter, year) to the next. This KPI is a great way to track the effectiveness of your strategies and measure your progress toward achieving sustainable profitability.
To calculate revenue growth rate, you’ll need the total revenue figures for two consecutive periods. You can use the following formula:
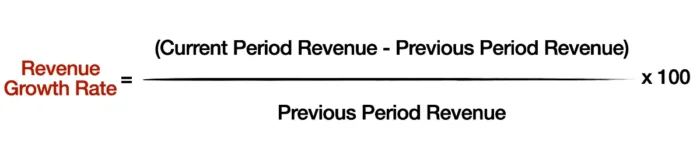
This calculation will give you the revenue growth rate as a percentage.
Let’s say you earned $150,000 in revenue in Q1 and then $180,000 in Q2. To calculate the revenue growth rate between these two quarters, you would subtract the Q1 revenue from the Q2 revenue, divide the result by the Q1 revenue, and then multiply by 100.
So, it would look like this:
Revenue Growth Rate = [($180,000 – $150,000) / $150,000] x 100 = 20%
This indicates a healthy 20% revenue growth rate from Q1 to Q2, which suggests that your strategies during this period effectively drove growth.
2. Average revenue per user/customer (ARPU)
Average Revenue Per User (ARPU) measures the revenue generated per user or customer over a specific period. It’s a valuable metric that offers insights into your company’s revenue patterns and the profitability of your customer base.
The ARPU metric can help you understand how well you are monetizing your users (existing customers) and measure the effectiveness of your pricing strategies. With this metric, you can make informed decisions about product development, marketing, and customer retention efforts.
The formula to calculate ARPU is as follows:
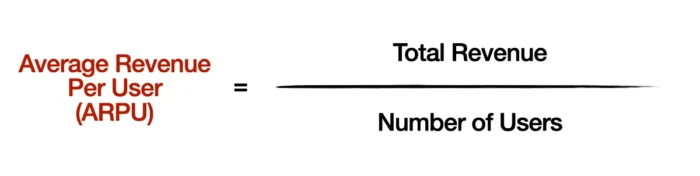
Let’s consider an example for better understanding. Suppose your SaaS startup has 500 subscribers and generates $25,000 in revenue in a given month. To calculate the ARPU for that month, you would divide the revenue by the number of subscribers:
ARPU = $25,000 / 500 = $50
This means, on average, each user contributes $50 to your startup’s revenue for that month.
3. Monthly recurring revenue (MRR)
Monthly recurring revenue (MRR) is the monthly revenue generated from your subscription-based products or services.
Tracking MRR allows you to monitor the growth and stability of your revenue streams. A steadily growing MRR indicates a strong business model and effective customer acquisition strategies.
The formula for calculating monthly recurring revenue is the following:
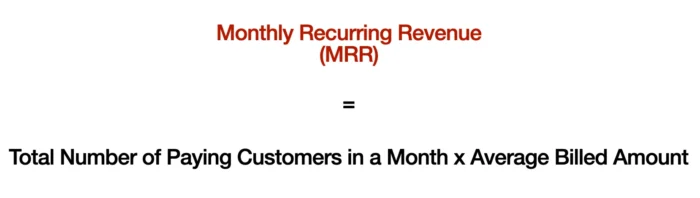
Let’s consider an example. Suppose your SaaS startup offers a project management tool with three pricing tiers: Basic at $10/month, Pro at $20/month, and Premium at $30/month. If your startup has 100 paying customers on the Basic plan, 200 on the Pro plan, and 50 on the Premium plan, the monthly recurring revenue would be calculated like this:
MRR = (100 customers x $10) + (200 customers x $20) + (50 customers x $30) = $1,000 + $4,000 + $1,500 = $6,500
This means your startup can expect to generate at least $6,500 in revenue each month, assuming no changes in its customer base or pricing.
The same calculation you can do for annual recurring revenue if you change the total number of paying customers in a month to a year and calculate the average billed account for the year.
Related: Real-life Organizational Decision-Making Examples
4. Average Monthly Revenue (AMR)
AMR is a measure of the average revenue your business generates each month. A rising AMR signals strong sales and effective pricing strategies, while a falling AMR could indicate potential issues that must be addressed and solved.
Calculating your AMR can be done with the following formula:
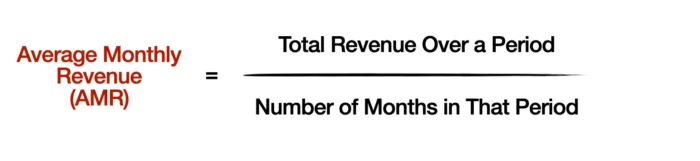
Imagine your startup generated revenue of $120,000 over the last year. To calculate your AMR, you would divide this revenue by the number of months in a year:
AMR = $120,000 / 12 = $10,000
This means that, on average, your startup generates $10,000 in monthly revenue.
5. Revenue churn rate (RCR)
Revenue churn rate (RCR), often called churn rate, is a vital KPI for startups, especially those using a recurring revenue model like a subscription-based business model.
RCR measures the percentage of revenue that your business loses over a given period due to customer churn.
A high RCR could signal dissatisfaction with your product or service, while a low RCR suggests that your customers find value in what you’re offering and choose to continue using your recurring services.
The formula for calculating RCR is as follows:
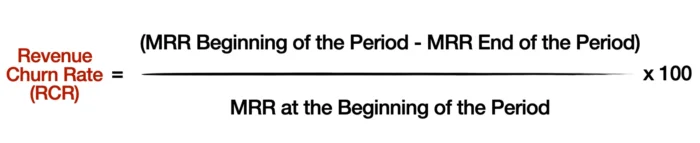
For example, your SaaS startup starts the month with an MRR of $10,000. Due to customer churn, the MRR drops to $9,000 by the end of the month. To calculate the RCR for that month, you would subtract the end-of-month MRR from the beginning-of-month MRR, divide the result by the beginning-of-month MRR, and then multiply by 100:
RCR = ($10,000 – $9,000) / $10,000 x 100 = 10%
This means that your startup experienced a 10% revenue churn rate for the month, indicating that it lost 10% of its recurring revenue due to customer churn.
6. Revenue Burn Rate
The rate at which the company is spending its capital. The burn rate is the rate at which your startup is spending its cash reserves. Tracking your revenue burn rate allows you to assess your financial runway and make necessary adjustments to ensure long-term sustainability.
A high burn rate might signal that you’re investing heavily in your business, which could be positive if these investments drive growth. However, if the burn rate exceeds your company’s revenue growth, it may lead to cash flow problems and risk your startup’s survival.
You can calculate your Revenue Burn Rate with the following formula:
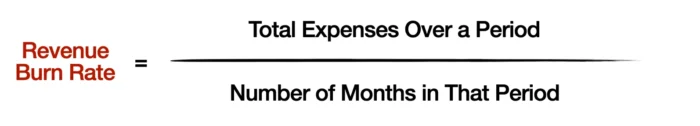
Suppose your startup have total expenses of $600,000 over the past six months. To calculate your Revenue Burn Rate, you would divide the total expenses by the number of months:
Revenue Burn Rate = $600,000 / 6 = $100,000
This means that, on average, your startup is burning through $100,000 of its monthly revenue.
7. Break-even point
The break-even point refers to the point at which your startup’s revenue equals its total costs. In other words, it’s the moment when your business neither makes a profit nor makes a loss. It’s an essential KPI because it helps you understand how much product or service you need to sell to cover your costs and start turning a profit.
Here’s the formula to calculate the break-even point:
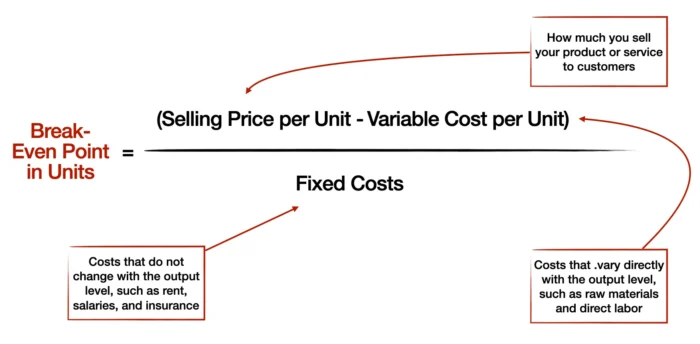
Suppose you run a startup that sells handmade candles. Your fixed monthly costs (rent, utilities, salaries) amount to $10,000. Each candle is sold for $20, and the variable cost per candle (wax, wick, fragrance) is $5.
Using the Break-Even Point formula, you would calculate:
Break-Even Point = $10,000 / ($20 – $5) = 666.67 candles
This means you must sell approximately 667 candles monthly to break even.
8. Cash runway
Cash Runway refers to the length of time your startup can continue to operate without generating additional income or raising more capital. In simpler terms, it’s the amount of time your business has before it runs out of cash.
Here’s the formula to calculate the cash runway:
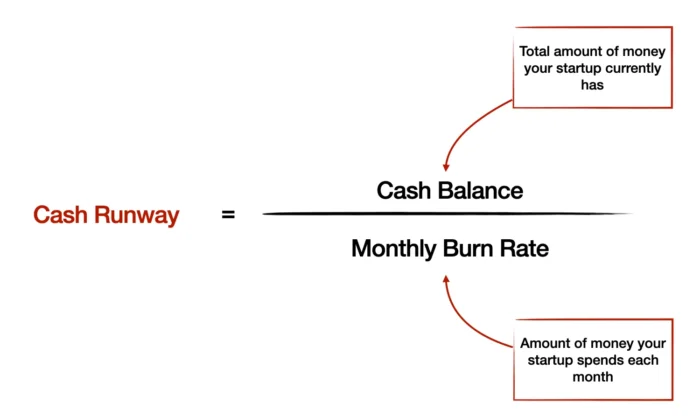
Let’s say your startup has a cash balance of $500,000 and a monthly burn rate of $50,000.
Cash Runway = $500,000 / $50,000 = 10 months
Given the current burn rate and calculated cash balance, your startup can continue to operate for approximately ten months before it runs out of cash.
9. Cost of goods sold
COGS refers to the direct costs of producing the goods or services your startup sells. This includes the cost of raw materials and the direct labor costs involved in producing your goods or services.
Here’s the formula to calculate COGS:
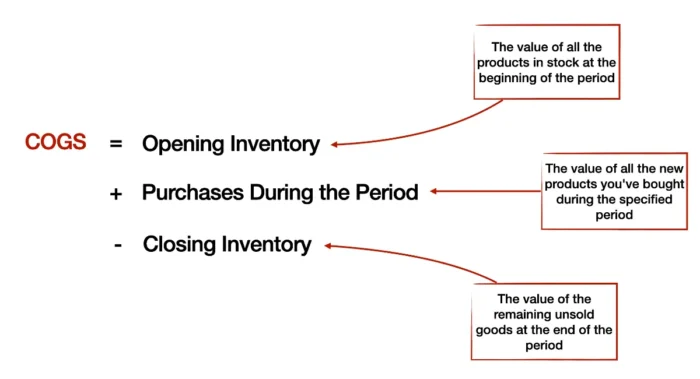
Suppose you run a startup that sells handmade soap. At the beginning of the month, your inventory is worth $5,000. You purchase an additional $2,000 worth of raw materials during the month. At the end of the month, your remaining inventory is worth $1,500. To calculate your COGS, you would use the formula:
COGS = $5,000 + $2,000 – $1,500 = $5,500
This means that the cost of producing the soap you sold during the month is $5,500.
10. Profit margins
Profit margins refer to the percentage of revenue that remains after your startup has paid for its costs and expenses. There are two profit margins:
- Gross Profit Margin: This is calculated by subtracting the COGS from revenue and then dividing the result by revenue. The formula is:
- Net Profit Margin: This is calculated by subtracting all operating expenses (including taxes and interest) from the gross profit and then dividing the result by revenue. The formula is:
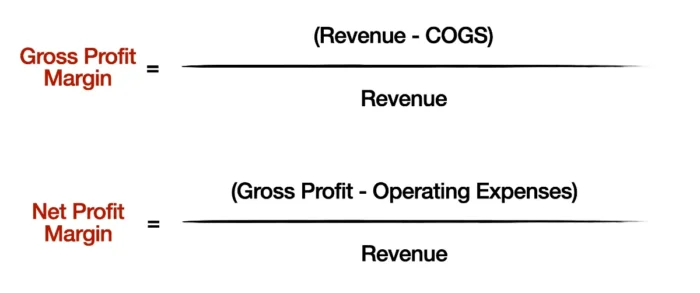
Suppose your startup generates $500,000 in total revenue, the COGS is $200,000, and operating expenses amount to $100,000.
- Gross Profit Margin = ($500,000 – $200,000) / $500,000 = 0.6 or 60%
- Net Profit Margin = (($500,000 – $200,000) – $100,000) / $500,000 = 0.4 or 40%
This means that for every dollar of revenue, your startup retains 60 cents as gross profit and 40 cents as net profit after all expenses are accounted for.
Marketing and Sales Key Performance Indicators
Since the nature of startups differs, so would the KPIs used to measure the effectiveness of campaigns. Common KPIs measure startup marketing success regardless of the business model, measuring performance and ensuring that efforts align with overall business objectives and company vision.
11. Total Addressable Market (TAM)
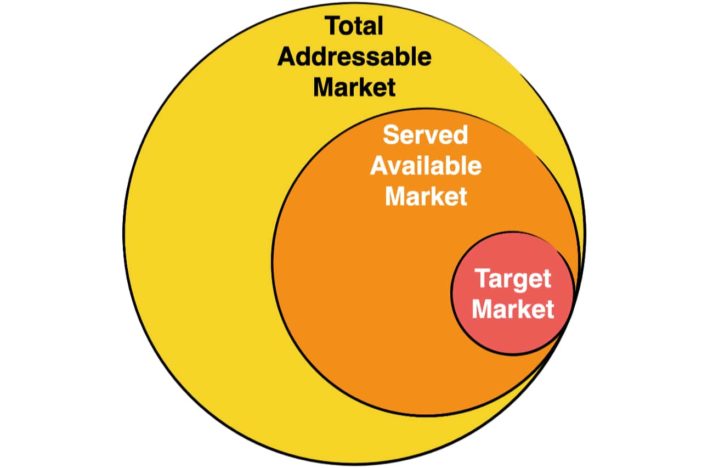
TAM represents the total revenue opportunity available for your product or service if 100% market share is achieved. It essentially estimates the maximum potential sales for a particular product or service.
Knowing your TAM allows you to understand the potential scale of your business. It lets you see the overall market growth opportunity and helps investors understand the potential return on their investment. If your TAM is small, even dominating that market may not lead to a substantial business. Conversely, a large TAM indicates significant growth opportunities, even if only a small market share is initially captured.
For the calculation of your TAM with examples, you can read more on how to identify the target market for your start-up.
12. Served Available Market (SAM)
SAM measures the portion of your total addressable market that your startup can realistically serve, considering its product, technology, and capacity constraints. While the Total Addressable Market (TAM) gives you an idea of the entire market’s size, SAM narrows it down to the segment your business can target with its current resources and capabilities.
Calculating the served available market may involve some market research and analysis, but it does not have a specific formula. You can find more details, with example of how to calculate your SAM here.
13. Market Share
Market share gives you an estimate of the percentage of sales (in terms of units sold or revenue generated) that your startup holds within its specific market.
This metric gives you an idea of how well you’re doing compared to your competitors. If your market share is growing, it’s a clear sign that your business strategies are effective and you outperform your competitors. Conversely, if your market share is shrinking, it could signal that competitors outperform you, and it might be time to reassess your strategies.
To calculate market share, you can use the following formula:
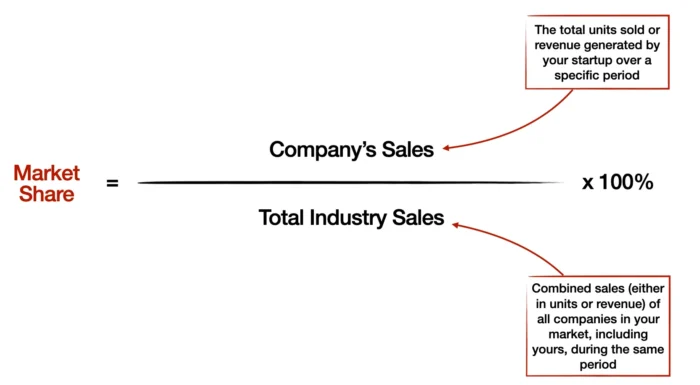
Let’s say that in the last year, your revenue generated is $1 million. During the same period, the total sales in your specific industry market were $20 million.
Market Share = ($1 million / $20 million) x 100% = 5%
This means your startup currently holds a 5% share of the market.
14. Cost per Lead (CPL)
Cost per lead can be defined as the total marketing cost incurred to acquire a potential customer or single lead. A lower CPL indicates a more efficient marketing strategy, while a higher CPL might suggest a need for optimization.
The formula to calculate Cost per Lead is straightforward:
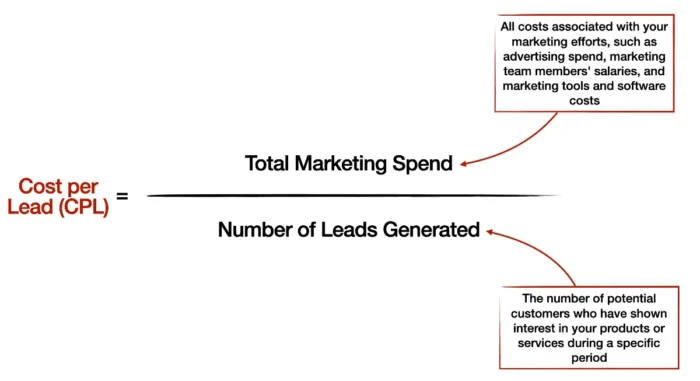
Suppose your startup’s total monthly marketing spend is $10,000, and you generate 200 leads during this period. To calculate your CPL, you would divide the total marketing spend by the number of leads generated:
Cost per Lead = $10,000 / 200 = $50
This means that your startup spends $50 to acquire each lead.
15. Customer Acquisition Cost (CAC)
Customer acquisition cost (CAC) refers to the cost shouldered by the company to acquire a new customer. It shows if marketing efforts were on point.
By tracking CAC, you can evaluate the effectiveness of your marketing and sales efforts and optimize your customer acquisition strategies.
The computation of the customer acquisition cost includes total sales and marketing expenses within a given period. These include multimedia advertising, content creation, social media marketing, pay-per-click campaigns, email marketing, and salaries.
Here’s how to calculate CAC:
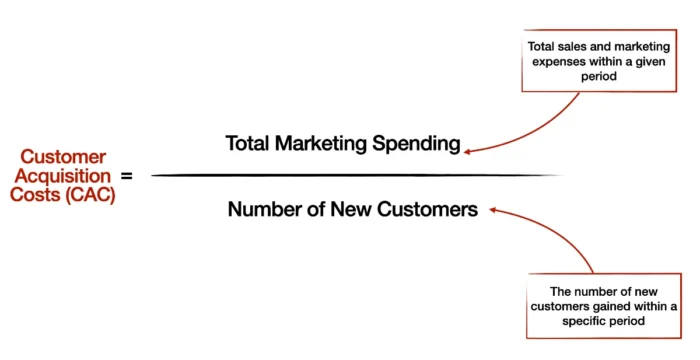
For instance, if USD$25,000 were spent in a month with 250 new customers, the customer acquisition cost would be USD$100.
16. Customer Lifetime Value (CLV)
Customer lifetime value helps you determine how much value different customers bring over their lifetime. It informs how much you should spend on customer acquisition and retention strategies. A high CLV indicates strong customer loyalty and efficient use of resources, while a low CLV might suggest that customer satisfaction or retention improvements are needed.
To calculate customer lifetime value, you can use the following formula:
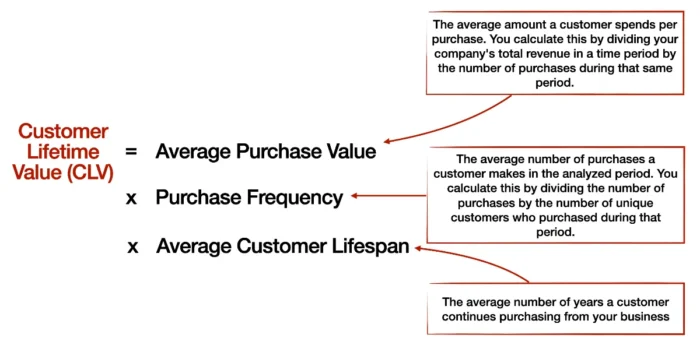
Let’s say you run a subscription-based startup offering a monthly wellness box. Your customers pay $30 monthly (average purchase value) and usually stay with your service for about three years (average customer lifespan). Since it’s a monthly subscription, the purchase frequency is 12 (one purchase per month).
Here’s how you would calculate your customer lifetime value:
CLV = ($30 x 12) x 3 = $1080
This means, on average, you can expect each customer to generate $1080 in revenue during their relationship with your business.
17. Customer churn rate
Customer churn rate is the percentage of customers who cancel their subscription or stop using your product or service within a given period. Tracking churn rate allows you to identify areas for improvement in your product or service and implement retention strategies to reduce churn.
The churn rate measures how many customers stopped buying a product or discontinued their subscriptions. The formula is as follows:
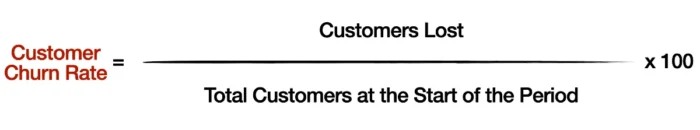
For example, if you have 100 customers at the start of the period but lose 15 of them, your customer churn rate is 15%.
Every business wants to ensure customer satisfaction, retain customers, and maintain a healthy revenue stream. But these goals aren’t being met when the customer churn rate is high. It could mean issues with product quality, pricing, or customer service.
18. Customer Retention Rate
The customer retention rate measures how well your startup can maintain its existing customer base over a specified period of time. Why does this matter? Not only is retaining customers generally more cost-effective than acquiring new customers, but existing customers are also more likely to try new products and spend more.
The formula to calculate the customer retention rate is:
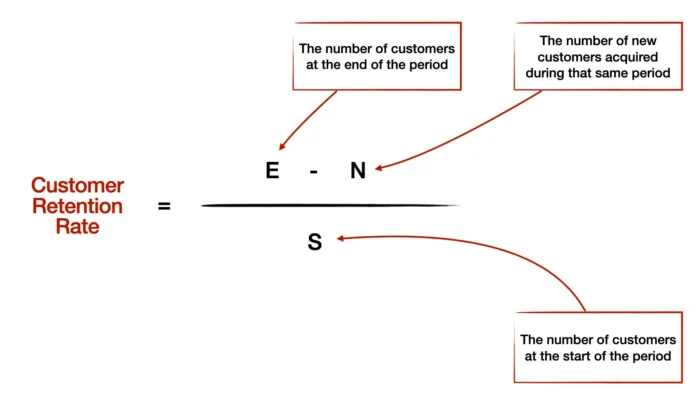
Suppose your startup began last quarter with 200 customers (S). Over that quarter, you attracted 50 new customers (N) and ended the quarter with a total of 220 customers (E).
Customer Retention Rate = ((220 – 50) / 200) x 100% = 85%
This means you retained 85% of your customers from the previous quarter, signaling a strong performance in maintaining customer relationships.
19. Conversion Rate
Conversion rate is the percentage of potential customers that complete a desired action or “convert” into leads or customers. This could be anything from purchasing, signing up for a newsletter, downloading an e-book, or any other action that aligns with your business objectives.
A high conversion rate means that your marketing efforts and offerings resonate with your target audience, while a low conversion rate may suggest you need to change something.
Here’s the simple formula:
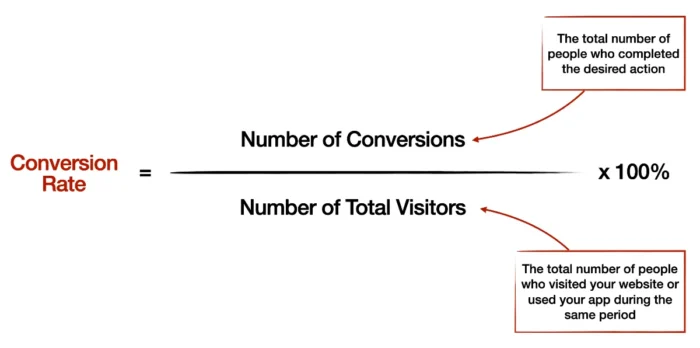
If you run an online store and had 10,000 visitors last month, and 200 of them made a purchase, your conversion rate would be:
Conversion Rate = (200 / 10,000) x 100% = 2%
This means that 2% of your website’s visitors became customers last month, providing a clear measure of the effectiveness of your sales and marketing strategies.
20. Customer Engagement
As a startup, it’s crucial to understand how users interact with your product or service. Customer engagement metrics consider user retention, growth, and customer satisfaction.
Customer engagement refers to the depth of a customer’s relationship with your brand. High customer engagement indicates strong customer loyalty, increased customer satisfaction, and a greater likelihood of business growth.
While there isn’t a one-size-fits-all formula to calculate customer engagement, it’s typically measured using a combination of metrics, such as:
- Website metrics: page views, bounce rate, average session duration, etc.
- Social media metrics: likes, shares, comments, followers, etc.
- Email metrics: open rates, click-through rates, and conversion rates.
21. Return On Marketing Investment (ROMI)
Return on marketing investment (ROMI) measures marketing costs per campaign versus revenue generated. Some factors include advertising, content creation, staff time, and agency fees.
The revenue generated directly from the campaign should be measurable, like sales and sign-ups. Here’s how to compute for ROMI:
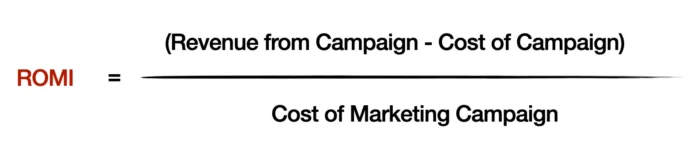
For example, if the revenue from the marketing campaign is $1,000 while the marketing cost is $200, the ROMI is 4. This means that for every $1 spent on marketing, the business generated $4 in revenue.
With ROMI, the higher the values, the better. By analyzing it across various marketing channels, campaigns, or segments, marketers can identify areas for improvement and allocate resources to the most effective marketing activities.
22. Net Promoter Score
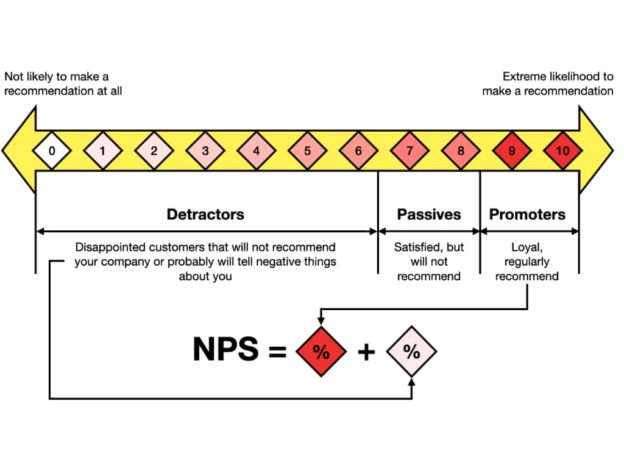
The Net Promoter Score (NPS) measures customer loyalty and satisfaction.
If you’re in the habit of answering surveys or recommending businesses on Facebook, you know about the NPS. Those replying to surveys are asked one question or its permutations: on a scale of 1-10, how likely will you recommend this service or product? Here is how to calculate NPS.
By tracking NPS, you can measure how likely your customers are to recommend your business to others and identify areas for improvement in your customer experience.
23. Customer Concentration Risk (CCR)
Customer concentration risk refers to the degree to which a substantial portion of your revenue comes from a small number of customers. You face a higher risk if much of your startup’s income relies on just a few clients. Should one of these customers cease their business with you, it could significantly impact your revenue and profitability.
The formula to calculate customer concentration risk is quite straightforward:
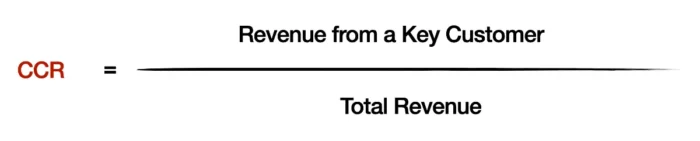
Suppose your startup has a total annual revenue of $1,000,000. Out of this, $400,000 comes from a single key customer. To calculate your CCR, you’d divide the revenue from the key customer by the total revenue:
CCR = $400,000 / $1,000,000 = 0.4 or 40%
This means that 40% of your startup’s revenue depends on one key customer, indicating a high customer concentration risk.
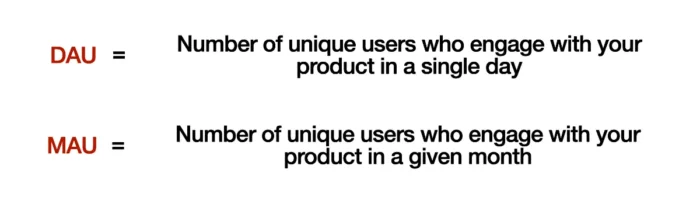
24. Daily Active Users (DAU) and Monthly Active Users (MAU)
Active users are the number of users who engage with your product or service within a given period. Tracking daily or monthly active users allows you to measure user engagement and assess the popularity of your product or service.
DAU is the number of unique active users engaging with your platform or product within a day. On the other hand, MAU measures the number of unique active users who interact with your product or platform within a given month. These metrics provide insight into how frequently users are engaging with your product and can indicate your product’s stickiness and engagement levels.
You would typically rely on analytics tools that track user interactions with your platform to calculate these figures.
Suppose you have a mobile app. You might find that around 500 unique active users each day open your app and interact with it somehow – perhaps by playing a game, making a purchase, or simply browsing. This would give you a DAU of 500.
Over the period of a month, let’s say 5,000 unique users interact with your app at least once. This would give you an MAU of 5,000.
Operation’s Metrics
25. Time to Market (ТТМ)
TTM refers to the тиме from when a product idea is first conceptualized to when it’s finally available for sale in the market. It reflects your startup’s efficiency and agility in transforming an idea into a product on the market.
Calculating TTM involves tracking the time spent across various stages of product development. A general calculation method of TTM would be:
Time to Market = Date of Product Launch – Date of Idea Generation
Suppose you have an innovative idea for an app on January 5, 2024. After going through all the stages of development, you finally launched the app on November 5, 2024. Here’s how you would calculate your TTM:
Time to Market = November 1, 2023 (Product Launch) – January 1, 2023 (Idea Generation) = 10 months
This means it took your startup ten months to transform your initial idea into a tangible product available for customers.
26. Innovation Pipeline Strength
Innovation Pipeline Strength measures the potential impact of your startup’s future products or services based on their current stage of development. It provides valuable insights into the health of your innovation process and the future growth prospects of your business. A strong pipeline signifies a continuous flow of innovative ideas, which are crucial for maintaining competitiveness and sustaining growth in the long run.
Due to the unique nature of innovation processes in different startups, there isn’t a one-size-fits-all formula to calculate Innovation Pipeline Strength. However, a general approach might involve evaluating each project in your pipeline based on factors such as:
- Market potential: What is the target market size for this innovation?
- Stage of development: How far along is this project in the development process?
- Strategic alignment: How well does this project align with your startup’s strategic goals?
Each project can be scored based on these factors, and the scores can then be aggregated to measure your overall Innovation Pipeline Strength.
Let’s say that your startup has three projects in its innovation pipeline. Each project is evaluated on a scale of 1 to 10 (with 10 being the highest) based on market potential, stage of development, and strategic alignment. The scores are as follows:
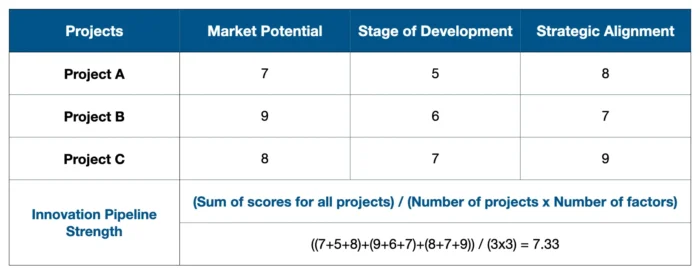
This suggests a relatively strong innovation pipeline, indicating promising future growth for your startup.
27. Operational Efficiency
Operational efficiency is a ratio of input to output in business operations that will tell you how well your startup uses resources like time, manpower, and money to generate value.
While there isn’t a universal formula for calculating operational efficiency due to the diversity of businesses and their processes, a general approach involves comparing inputs and outputs. One popular method is to calculate the Operational Efficiency Ratio:
Operational Efficiency Ratio = Inputs / Outputs
A lower ratio indicates higher operational efficiency.
Let’s say your input, like operating expenses, includes salaries, rent, utilities, and software licenses, amount to $500,000 in a year. Your startup generates revenues (output) worth $1,000,000 during the same period.
Operational Efficiency Ratio = $500,000 / $1,000,000 = 0.5
This suggests that for every dollar of revenue your startup generates, it spends 50 cents on operating expenses. The remaining 50 cents can be seen as the result of your operational efficiencies.
28. Supply Chain Costs
Supply chain costs are costs associated with the supply chain process can significantly. By monitoring and optimizing this KPI, you can identify inefficiencies, reduce unnecessary expenses, improve profitability, and deliver better value to your customers.
The basic formula for calculating supply chain costs includes the sum of all costs associated with product procurement, production, storage, and delivery. This typically involves:
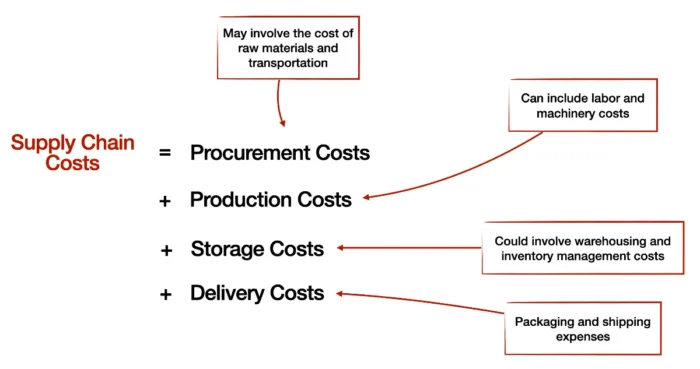
If you’re running an e-commerce startup and your annual costs are as follows:
- Procurement Costs (materials, transportation): $20,000
- Production Costs (labor, machinery): $30,000
- Storage Costs (warehousing, inventory management): $10,000
- Delivery Costs (packaging, shipping): $15,000
Supply Chain Costs = $20,000 (Procurement) + $30,000 (Production) + $10,000 (Storage) + $15,000 (Delivery) = $75,000
This means your startup spends $75,000 annually to operate its supply chain. Having this figure helps you understand a significant portion of your operational expenses and provides a basis for identifying areas where you can improve efficiency and reduce costs.
29. Order Fulfillment Time
This metric measures the time it takes from placing an order until it is delivered to your customer. The speed and efficiency of your order fulfillment process can significantly impact your customer satisfaction and loyalty. Remember, any possible delay could lead to customer dissatisfaction, negative reviews, and potentially lost business for you.
You can calculate order fulfillment time with the following formula:
Order Fulfillment Time = Time of Delivery – Time of Order Placement
This calculation provides you with the total time taken to fulfill an order. It’s typically measured in hours or days, depending on the nature of your business and the products you offer.
Let’s consider an example to illustrate this concept better. A customer places an order on your website at 9:00 AM on Monday. The order is delivered to the customer at 2:00 PM on Wednesday.
Here’s how you would calculate your Order Fulfillment Time:
Order Fulfillment Time = 2:00 PM Wednesday – 9:00 AM Monday = 53 hours
This indicates that it takes approximately 53 hours (or just over two days) to fulfill an order.
Remember, the goal should always be to minimize order fulfillment time while maintaining high-quality service. Fast fulfillment shouldn’t come at the expense of accuracy or quality. You wouldn’t want to rush orders and risk making mistakes, which could lead to returns, refunds, and dissatisfied customers.
30. On-time Delivery Rate
This metric measures the percentage of customer orders within the promised delivery timeframe. Delivering orders on time can significantly improve your customer satisfaction and increase your reputation and customer loyalty.
To calculate the On-time Delivery Rate, you use the following formula:
On-time Delivery Rate = (Number of Orders Delivered On Time / Total Number of Orders Delivered) x 100%
Let’s take a practical example. Over a month, you delivered 500 orders, out of which 450 were delivered within the promised delivery timeframe.
On-time Delivery Rate = (450 / 500) x 100% = 90%
This means that 90% of your orders were delivered on time, which is an excellent rate. However, it also indicates that 10% of your orders did not meet the promised delivery timeframe, signaling a need for improvement.
31. Inventory Turnover
Inventory turnover measures how often a company sells and replaces its inventory within a certain period (typically a year). A high inventory turnover ratio could indicate strong sales or effective inventory management, whereas a low ratio might suggest weak sales or possibly overstocking, which could lead to outdated inventory and tied-up capital.
The formula to calculate inventory turnover is following:
Inventory Turnover = Cost of Goods Sold (COGS) / Average Inventory
Average inventory is typically calculated by adding the beginning and ending inventory for the period and dividing by two.
To illustrate this concept, let’s consider an example. Your COGS for the year is $200,000. At the beginning of the year, your inventory was worth $50,000, and at the end of the year, it was worth $30,000.
Average Inventory = ($50,000 + $30,000) / 2 = $40,000
Inventory Turnover = $200,000 / $40,000 = 5
This means you sold and replaced your inventory five times over the course of the year.
Understanding your inventory turnover rate can help you make informed decisions about production, sales, and pricing strategies. For instance, if your inventory turnover is low, you might consider improving your marketing campaigns to increase sales or reassessing your production schedule to avoid overstocking.
Conclusion and key takeaways
By monitoring and analyzing the right startup metrics, you can measure your progress toward your targets and benchmarks, identify areas for improvement, and uncover hidden opportunities. Remember that all startup metrics will provide valuable insights into your startup’s health and performance.
Carefully tracking startup KPIs and metrics is one practice that you should implement, and in such a way, your startup can avoid disasters and make data-driven decisions that are timely, strategic, productive, and profitable.